Optimal Tail-Risk Hedging

It is well known that the appropriate selection of assets and their respective weights in a portfolio can significantly influence investment outcomes. In this article, we will evaluate a variety of conventional instruments that may help protect portfolios against market downturns and enhance the risk-return profile, based on historical data. We will use metrics such as individual Compound Annual Growth Rates (CAGRs) and Sharpe ratios measured in different market regimes: RISK-ON and RISK-OFF. The ultimate goal is to identify a strategy that provides a favorable trade-off between performance in both regimes, ideally performing exceptionally well during market downturns while avoiding substantial losses during market expansions.
The model portfolio we aim to protect has 100% of its allocation in the S&P 500 index stocks, represented by the SPY ETF. The table below displays asset classes that could be used as potential hedges:
| Strategy Class | Specific Strategies or Assets | Description |
| Bonds | TLT, LQD | “Safe Heaven” assets, which include long term treasuries, and investment grade corporate bonds, all modelled by most liquid ETFs; |
| Metals | GLD, SLV | Gold, Silver - the “Store of Value” commodities, that should protect investors from inflation and risks of the financial system; |
| Defensive Industries | XLU, XLP | Utilities and Consumer staples, that provide more stable cash flows and tend to outperform during market turmoil periods. |
| Long-Short Portfolios | Idiosyncratic Volatility(Low_id_Vol), Market Beta(Low_Beta) | Long-short stock portfolios are constructed based on factors that should be inversely correlated with market during drawdown periods, such as market betas and idiosyncratic volatility. The execution process is as follows: at the beginning of each month, we sort all available stocks by the chosen variable (historical beta or volatility), then buy 10% with the lowest values, and short 10% with the highest values. |
| VIX | VXX | Long position in volatility is executed via holding corresponding ETF. |
| Left Tail Hedge Option Strategy | LeftTailHedge | More effective strategy than simply buying put options and is widely known as options-based hedging approach. The execution of this strategy is as follows: Every month, an out-of-the-money put option on SPY with 1 year to expiry is purchased. The position size is calculated such that 2% of the entire portfolio is spent on option premiums per year. If the price of the option increases more than 15 times relative to its cost during its lifespan, we sell it. The logic behind this strategy is that we are consistently buying market insurance, and during periods of high uncertainty, we sell it for a significant profit. |
The table below shows the performance of the instruments during the full period 2004-2023.
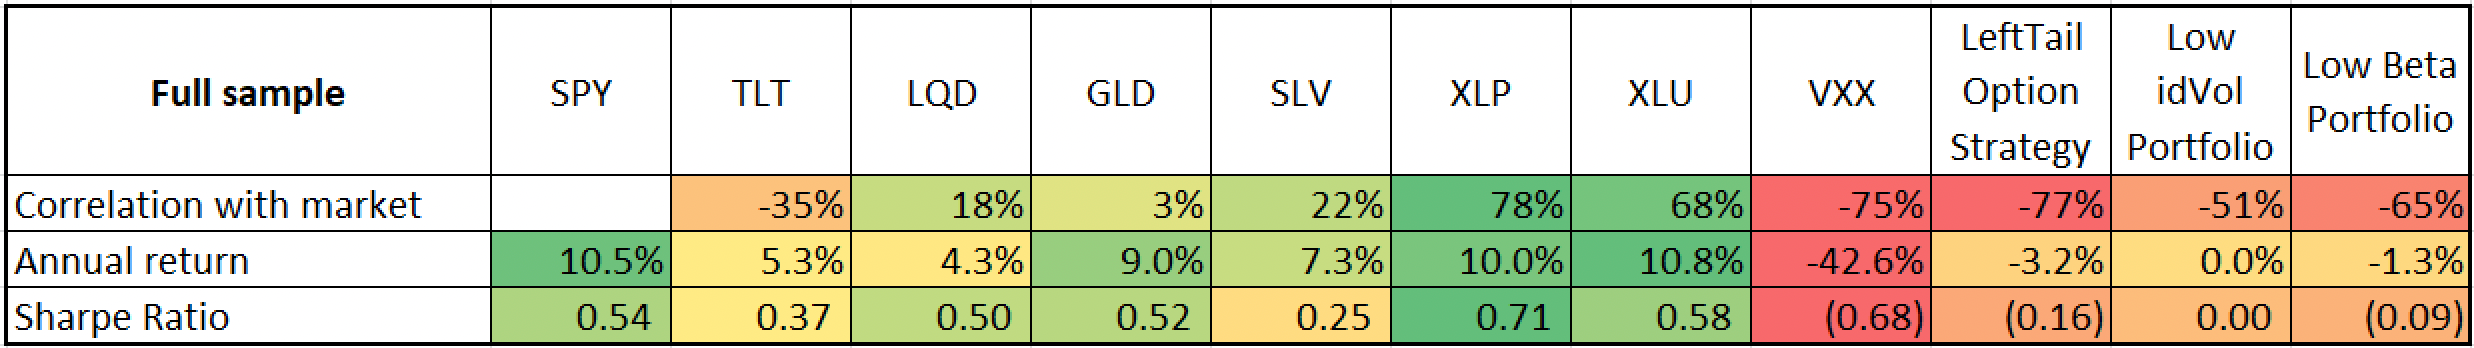
We can see that all assets, excluding volatility and long-short strategies, have positive average returns over the entire period, with equity assets (SPY, XLU, XLP) performing the best. It is also worth noting that equity assets have a positive correlation with the market index, while metals and corporate bonds exhibit near-zero correlation. Long-term treasuries have a negative correlation with the stock market. Volatility and long-short strategies are highly negatively correlated with the index.
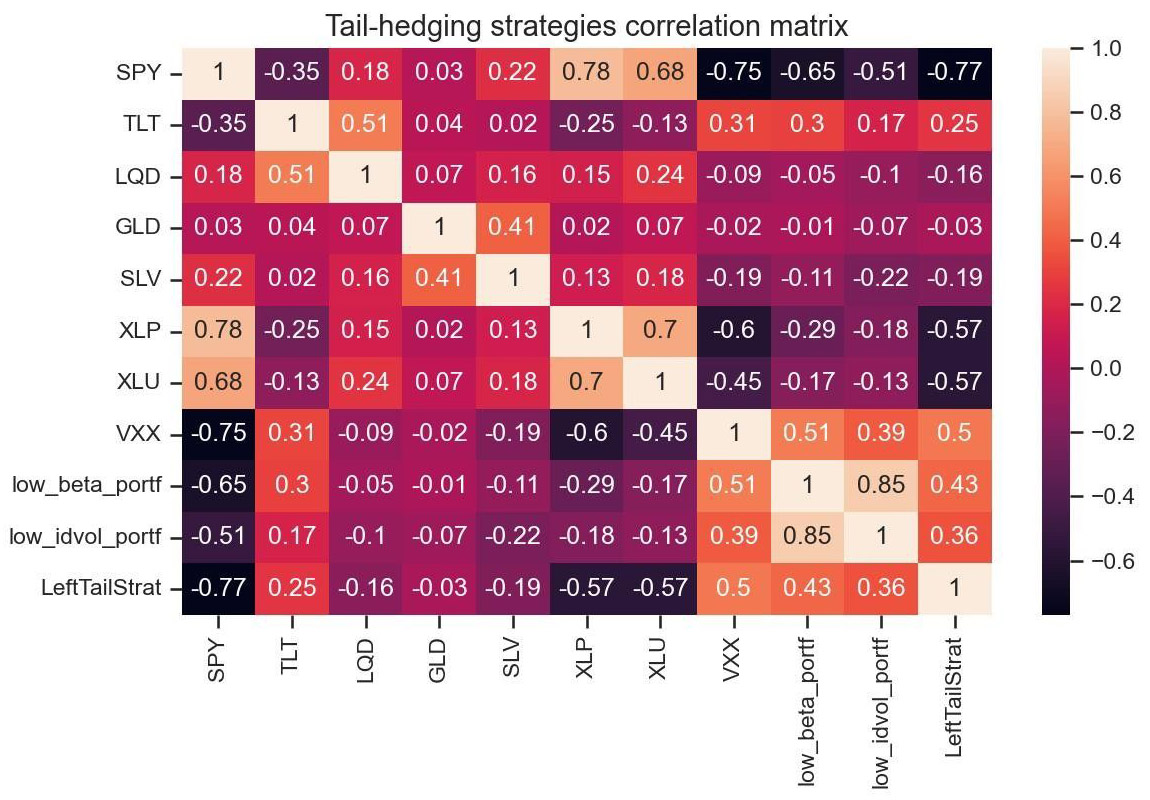
The following table presents a cross-asset correlation matrix for the entire period, revealing that apart from equity-based assets and volatility strategies, there are no clusters with even moderately high correlation. This indicates that we have a sufficiently diverse set of hedging strategies at our disposal.
To assess the hedging capabilities of the selected assets, we split our period into two regimes: Market Expansion (RISK-ON) and Market Drawdown (RISK-OFF). We label a sub-period as RISK-OFF if there is more than a 10% drawdown within a month before or after that.
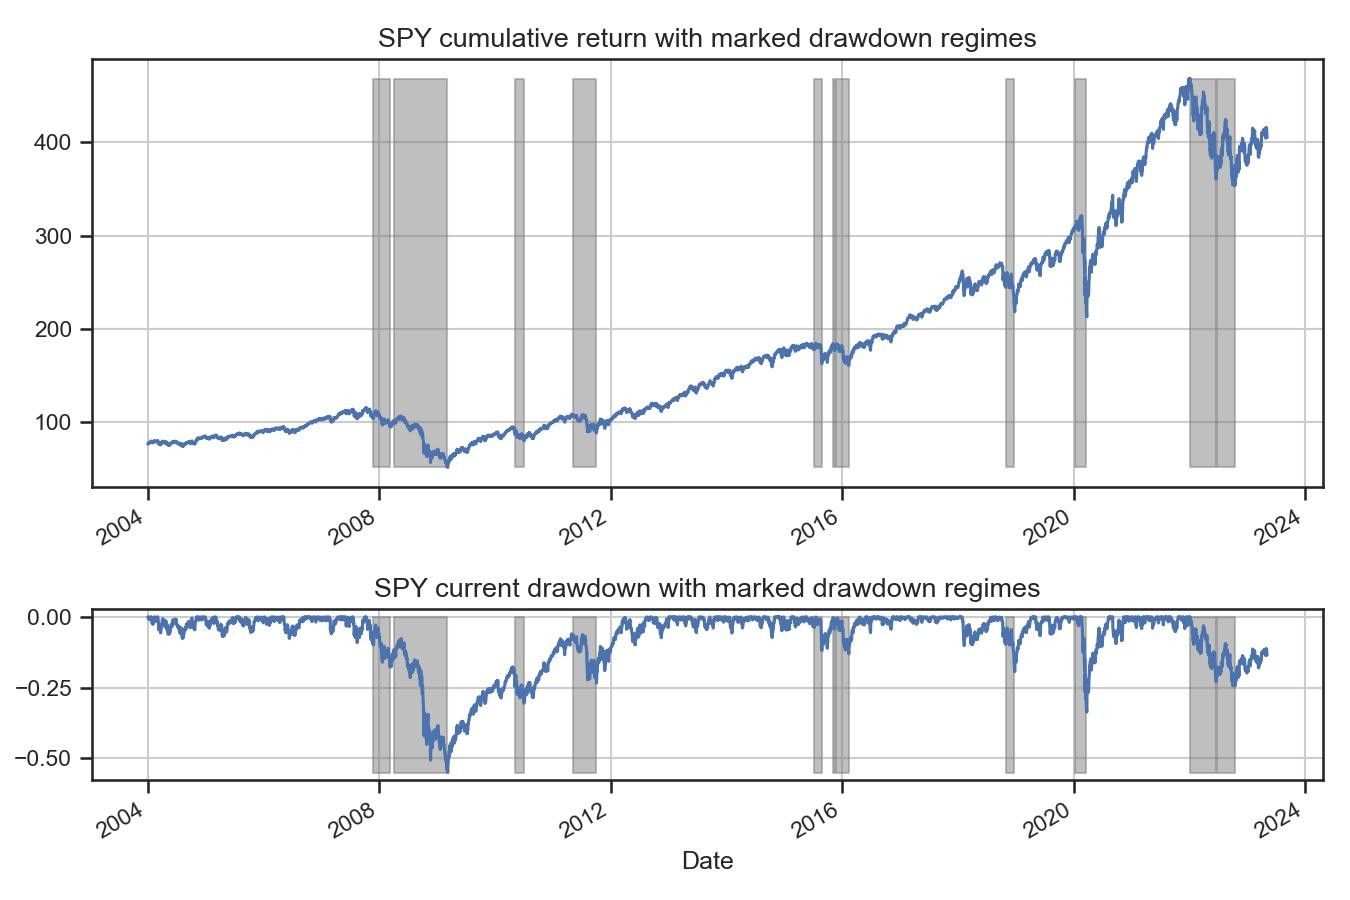
The plot above highlights market panic periods based on previously formulated criteria. As we can see, since 2004, there have been two long (over one year) periods classified as market drawdown regimes - in 2008 and 2022. Additionally, there have been five short-term corrections during which drawdowns did not exceed 20%, and one short but deep correction in 2020.
The table below illustrates the asset performance during the RISK-ON or calm market regime.
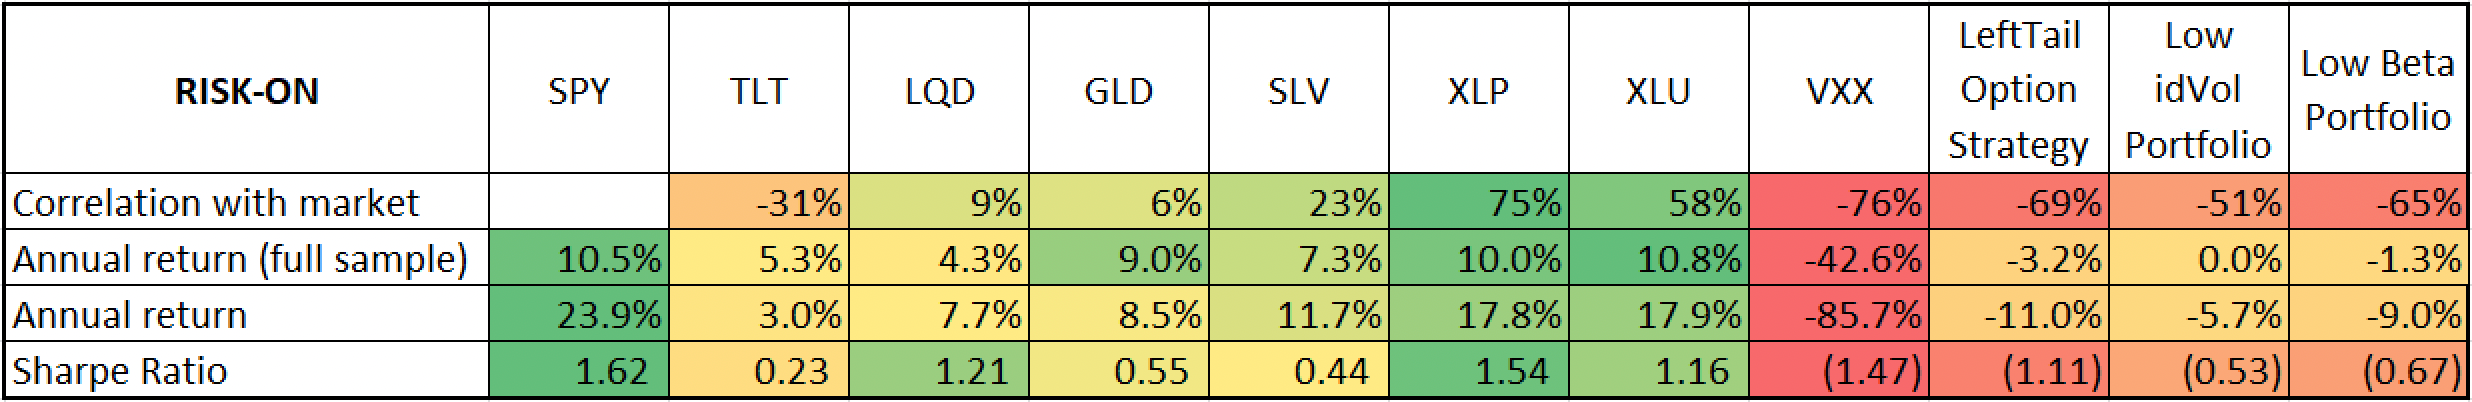
Strategies that show improved performance during these periods of expansions include: XLP, XLU, SLV, and LQD, which likely indicate “RISK-ON” assets. All other assets have lower "RISK-ON" performance relative to the full sample, with VXX experiencing the worst performance degradation at a -80% CAGR.
The table below presents the performance results during RISK-OFF periods, which are the most interesting.
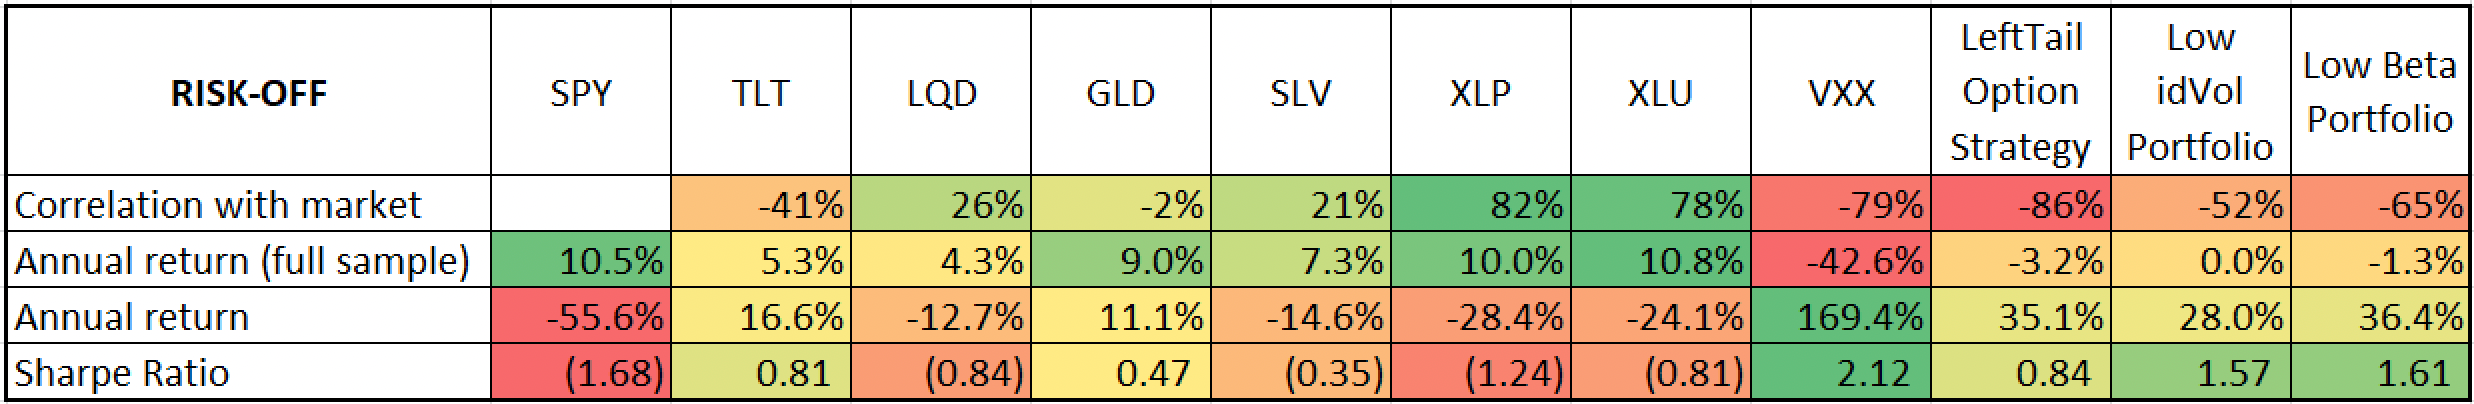
As expected, the "RISK-ON" assets defined earlier (XLP, XLU, SLV, and LQD) all have negative returns, confirming that they are not optimal hedge instruments. Meanwhile, the option and long-short equity strategies demonstrated significant performance improvements relative to the expansion regime, with the largest difference of almost 200% attributed to VXX. However, volatility-based strategies have very high opportunity cost compared to long-short equity strategies, which have almost zero cost of carry in the long run. Notably, the only two assets with positive returns regardless of market direction are long-term Treasuries and Gold, justifying their reputation as canonical protective instruments.
Optimal risk-sensitive hedge
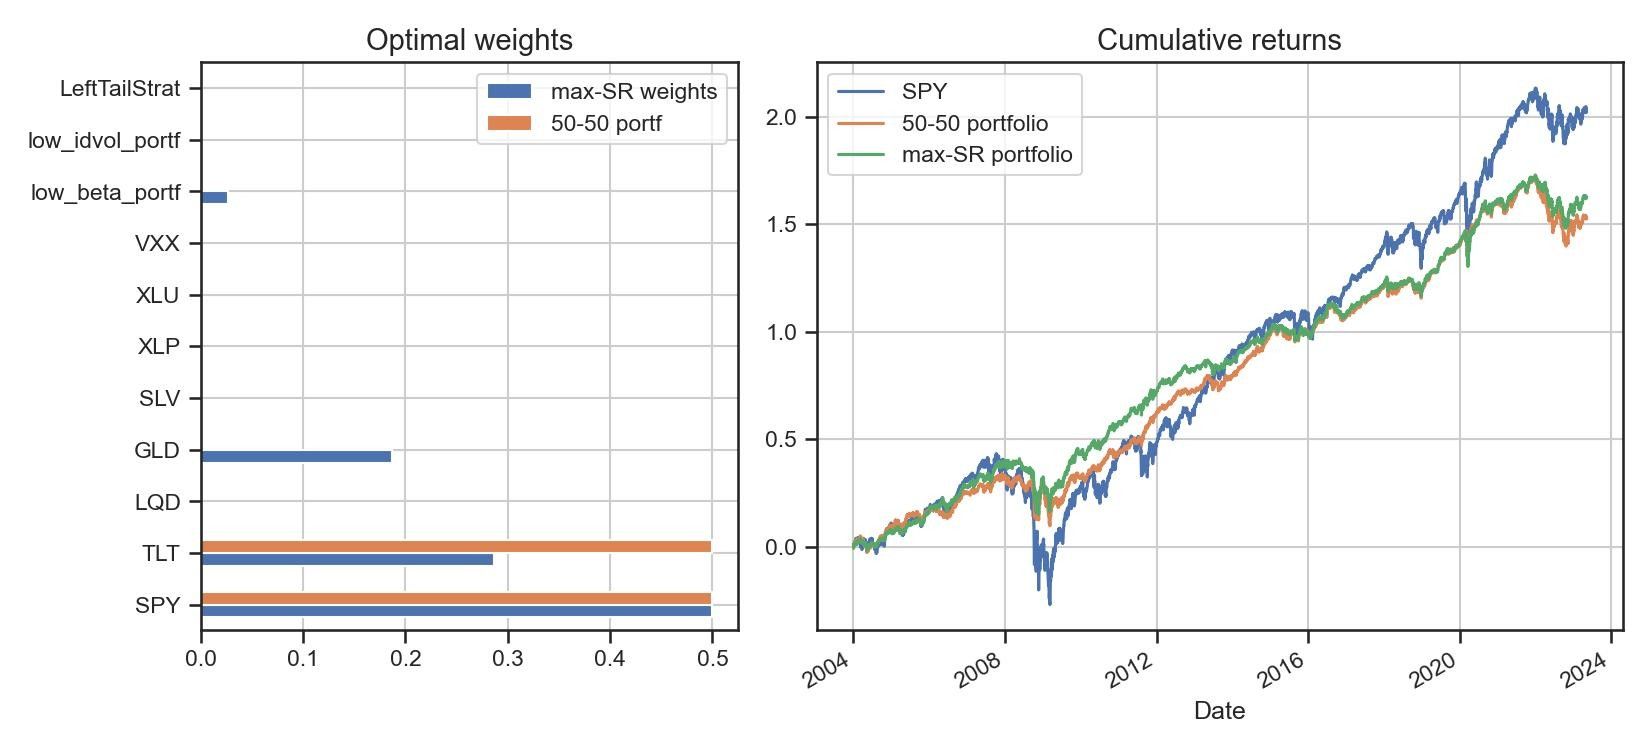
We have discussed the individual performance of each strategy in different market regimes. But what if our aim is to construct a blend of strategies optimized for overall portfolio performance? To approach this task, we optimize the weights of all selected assets to maximize the historical Sharpe ratio, while maintaining the CAGR above the 50-50 portfolio’s historical level. Note that the weight of SPY in the portfolio is fixed at 50%, and we are only optimizing the "hedging" part. We compare the target portfolio with an unhedged 100% SPY portfolio and a classical 50-50 portfolio consisting of half SPY and half TLT.
The results of the examined portfolios are displayed in the table below.
| Portfolio | Sharpe Ratio | CAGR | Max DD |
| SPY | 0.54 | 10.5% | -70% |
| 50-50 portfolio | 0.81 | 7.9% | -33% |
| Max-SR portfolio | 0.88 | 8.4% | -26% |
As mentioned earlier, the hedging part constitutes 50% of the entire portfolio. The optimal weights to maximize the Sharpe ratio are calculated as follows: TLT - 18.8%, GLD - 8.9%, Low_Beta portfolio - 14.9%, and Low_id_Vol portfolio - 7.4%
In conclusion, we have backtested and analyzed 10 hedging strategies and identified RISK-ON assets - XLP, XLU, LQD, SLV - which did not exhibit significant hedging power during periods of high uncertainty. Additionally, we excluded strategies with high opportunity costs - VXX and Option-based LeftTailHedge, leaving us with a set of four assets: the classical TLT and GLD, and the less popular Low Beta and Low Idiosyncratic Volatility long-short portfolios. Through numerical optimization, we achieved even better results, creating a portfolio with a drawdown 1.5 times lower than the standard 50-50 portfolio, while also exhibiting a higher Sharpe ratio and CAGR.
Finally, it is worth noting that these results are applicable for hedging a long portfolio of an equity index and may vary for other initial portfolio allocations.
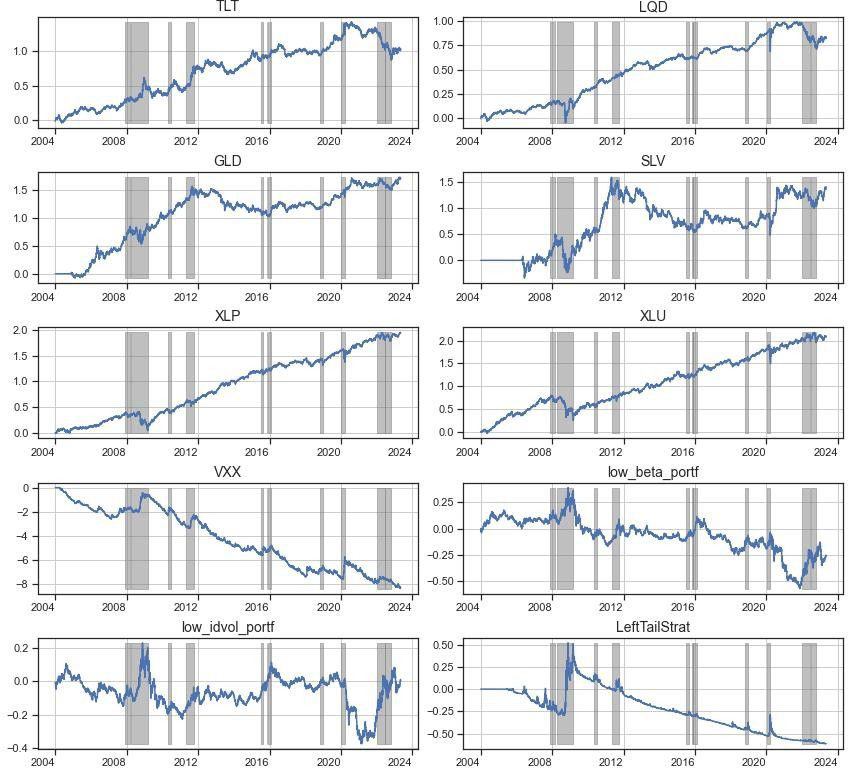
Appendix. Performance plots of all hedging strategies with highlighted RISK-OFF regimes.