The Race of Asset Allocation Strategies

Asset allocation represents one of the largest groups of investment strategies. The general idea is to choose a combination of assets that complement each other and together will perform better than a selected benchmark. Asset allocation strategies aim to balance risk and return by distributing the portfolio among various asset classes, such as stocks, bonds, cash, etc. They are quite simple to implement and can be used by both individuals and professional market participants.
There is a broad variety of asset allocation investment strategies - from the simplest fixed rules (like 60% stocks, 40% bonds) to fairly complex optimization methods and tactical allocations. Many such strategies have emerged in recent years, flourishing largely due to favorable conditions - a long-term trend of declining bond yields that began in the 1980s, coupled with a pronounced long bull market in stocks.
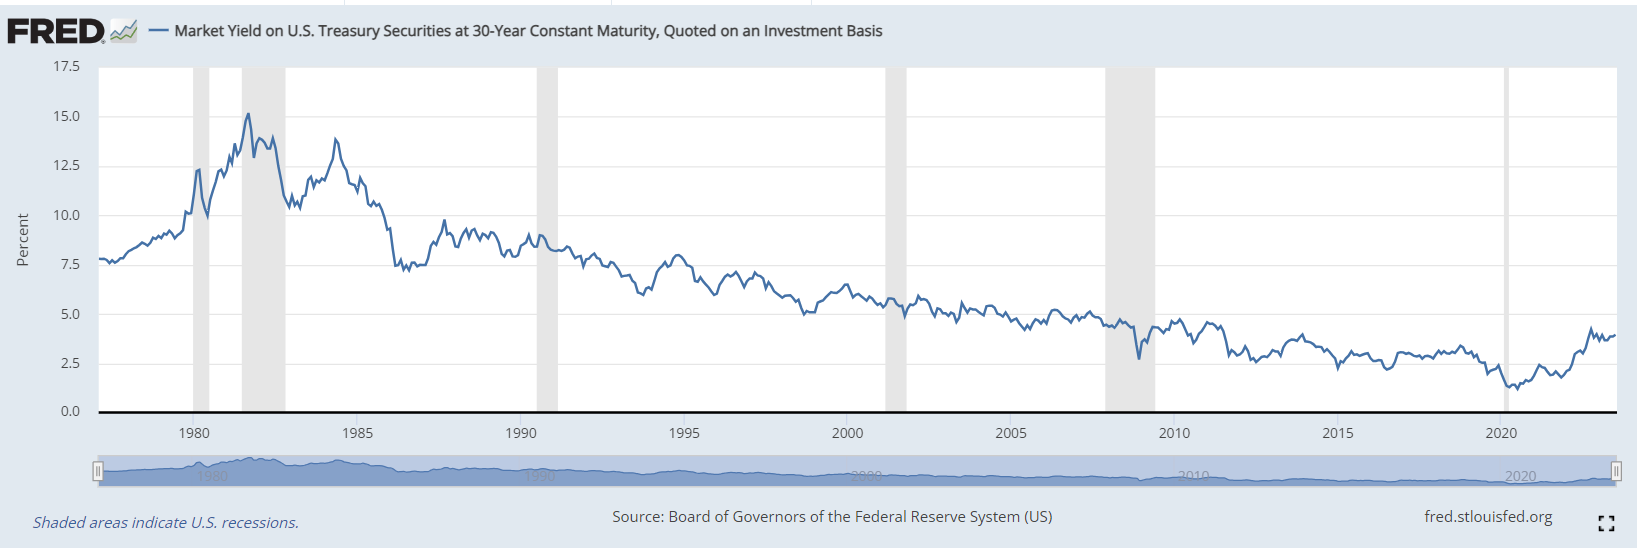
Everything changed in 2022 when spike in inflation and the subsequent rise in Federal Funds rate led to a sharp simultaneous decline in both major asset classes - bonds and stocks. This makes it even more interesting to evaluate the behavior of the most well-known strategies of this class in recent years.
In this article, we have selected nine of the most well-known strategies from this group and evaluated their performance over the recent 10-year period, from July 2013 to July 2023. We have included only those strategies in our analysis that were described before the start of that period, in order to avoid curve-fitting. Positions are rebalanced on the first day of each month.
- 60/40. One of the most traditional asset allocation strategies. It involves allocating 60% of your portfolio in stocks and 40% in bonds. This approach is predicated on the assumption that stocks will provide a higher return than bonds over the long term, while bonds contribute stability and income. For our stock proxy, we use the SPY ETF, and for bonds, we use TLT, a long-term treasury ETF.
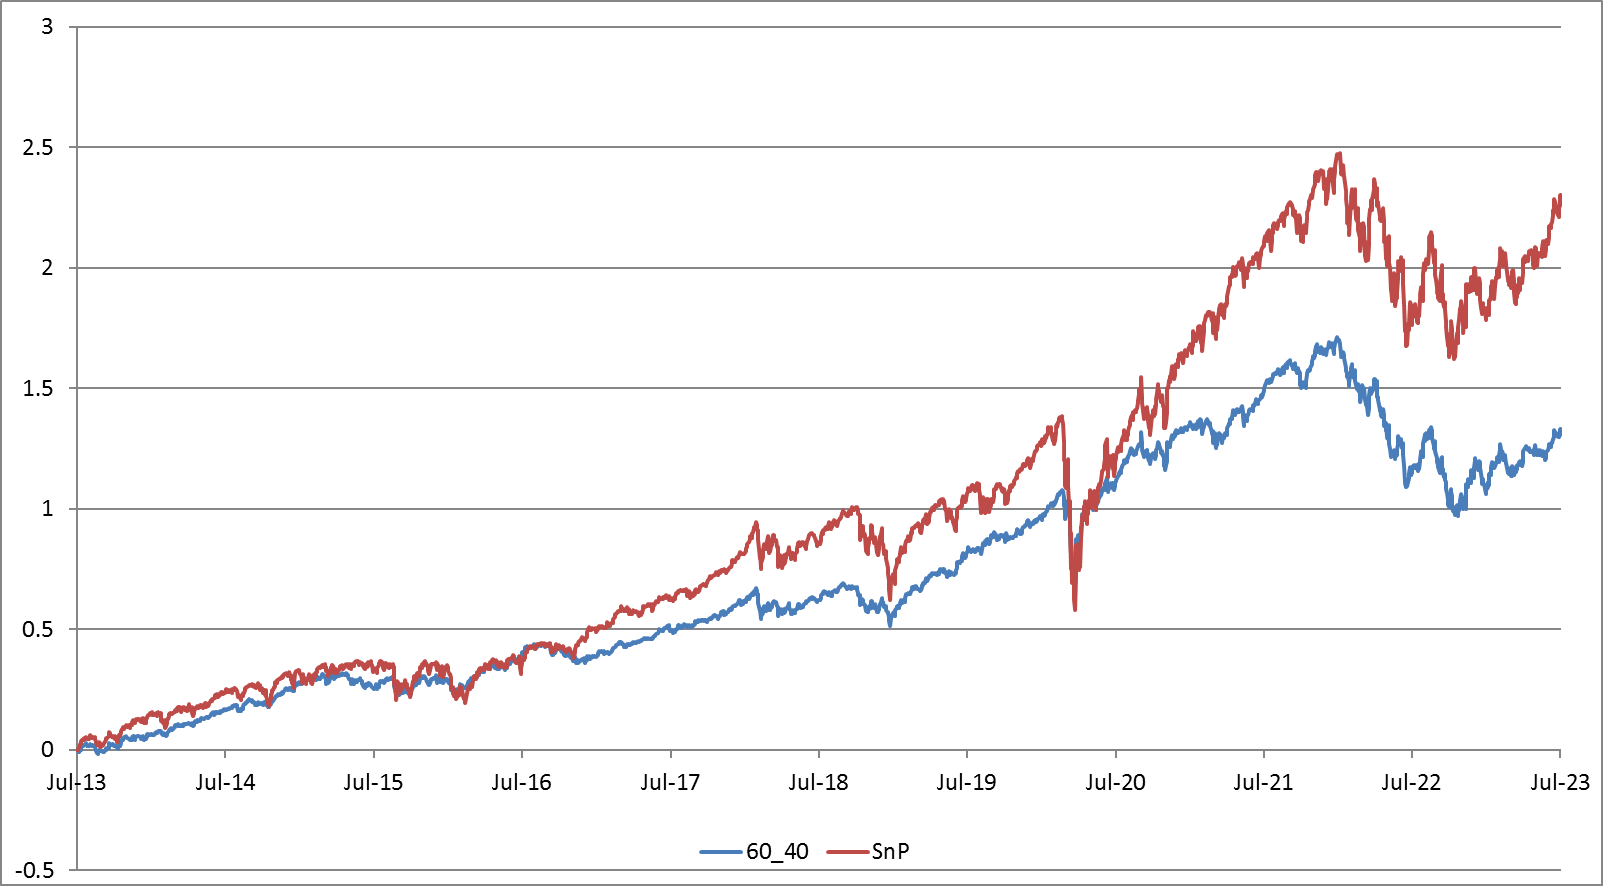
| CAGR | Sharpe | MaxDD | |
| 60_40 Portfolio | 8.8% | 0.82 | -30.9% |
| SnP | 12.7% | 0.68 | -33.7% |
- Risk Parity. This strategy aims to balance risk by allocating funds across various asset classes based on risk (volatility) rather than on expected return. This approach often results in a higher allocation to bonds compared to other strategies. In our study, we adopt a simple scenario for analysis - without a dynamic recalculation of asset risk. We will base our work on the article “The Risk Parity Approach to Asset Allocation” by Callan Investments Institute to define assets weights. They are provided in the table below.
| Asset type | ETF | Weight |
| US Equity | SPY | 10% |
| Non-US Equity | VXUS | 9% |
| Real Estate | VNQ | 11% |
| Commodities | DBC | 12% |
| Fixed Income | BND | 58% |
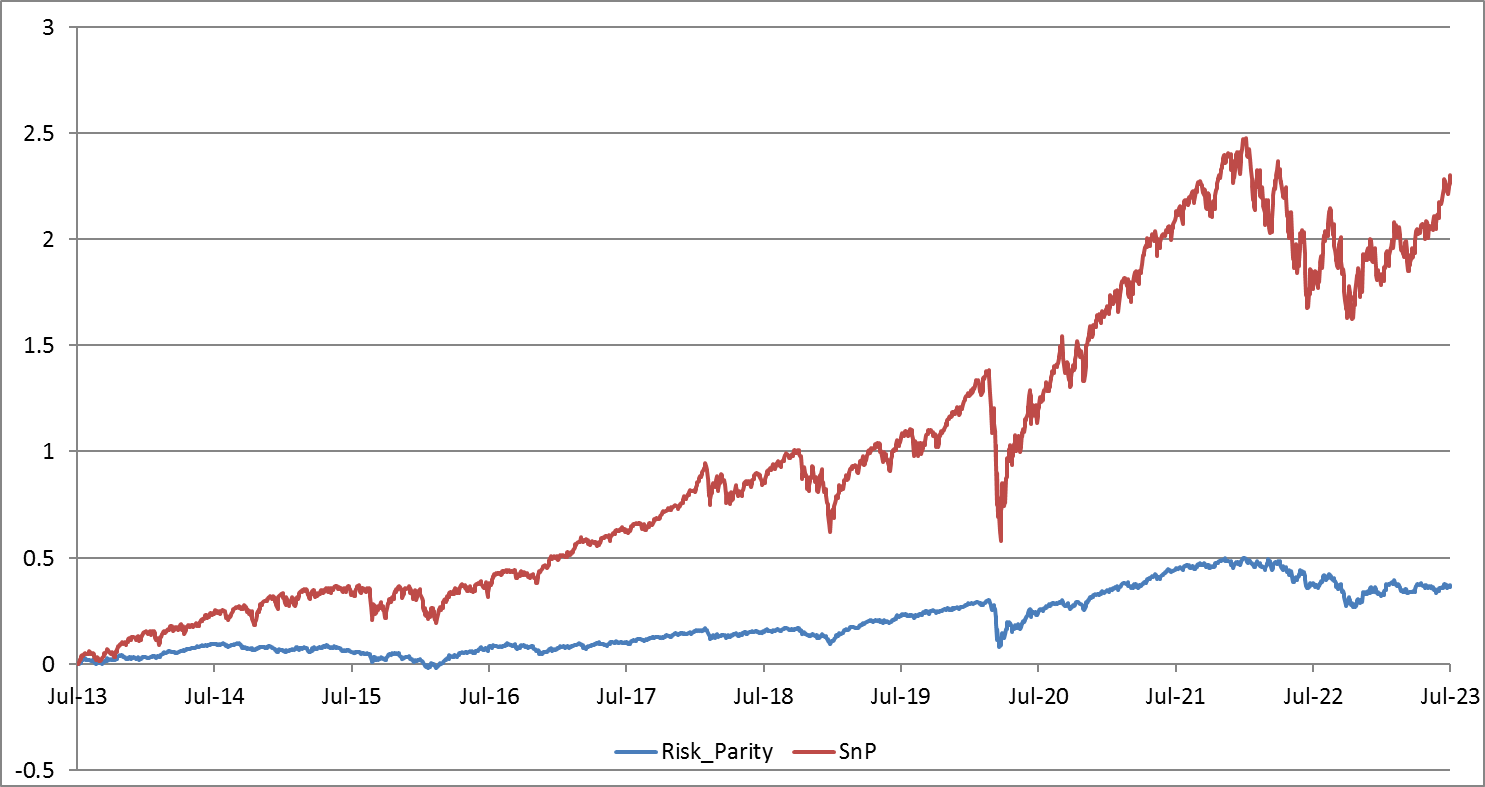
| CAGR | Sharpe | MaxDD | |
| Risk Parity Portfolio | 3.2% | 0.44 | -18.3% |
| SnP | 12.7% | 0.68 | -33.7% |
- All-Weather Portfolio. Proposed by Ray Dalio, the founder of Bridgewater Associates, this strategy attempts to perform well during all economic environments. It includes a mix of 30% stocks, 40% long-term bonds, 15% intermediate-term bonds, 7.5% gold, and 7.5% other commodities.
| Asset type | ETF | Weight |
| Stocks | VTI | 30% |
| Long-term bonds | TLT | 40% |
| Intermediate-term bonds | IEI | 15% |
| Gold | GLD | 7.5% |
| Other commodities | DBC | 7.5% |
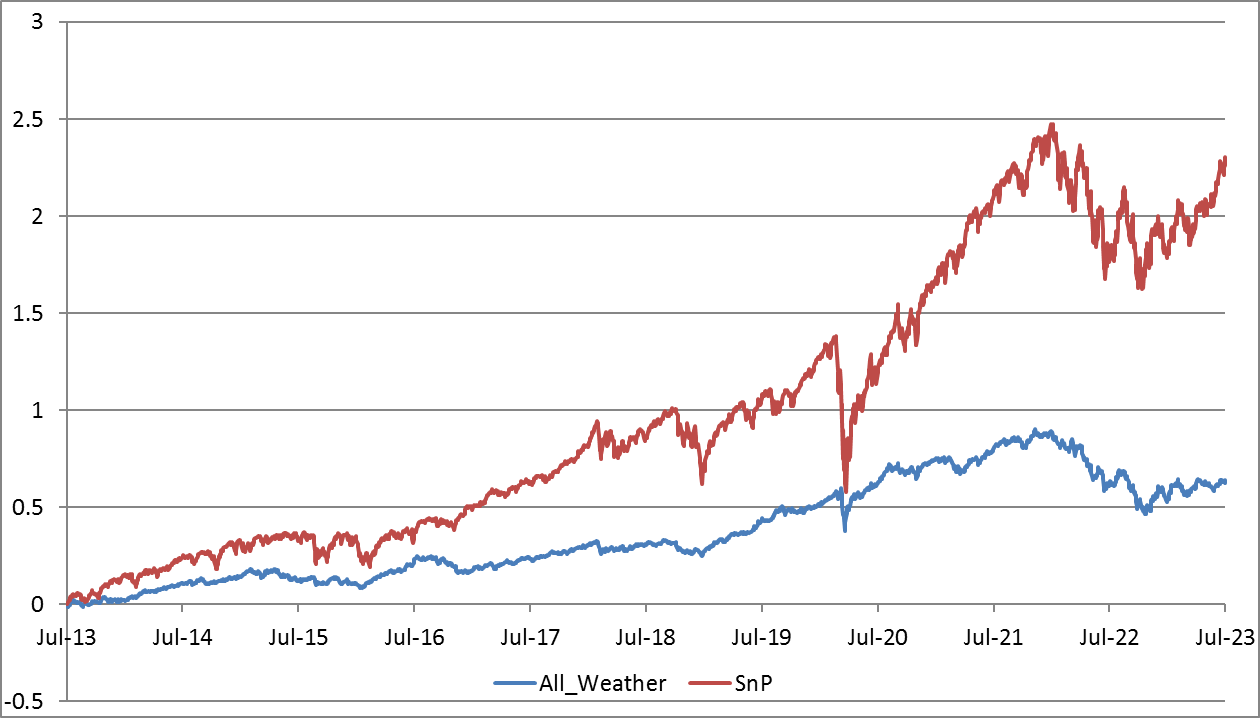
| CAGR | Sharpe | MaxDD | |
| All Weather | 5.1% | 0.63 | -25.7% |
| SnP | 12.7% | 0.68 | -33.7% |
- Global Tactical Asset Allocation (a legacy of Meb Faber's Ivy Portfolio). This strategy is described here. We use the median version of it. According to this approach, out of 13 types of assets, those priced above their 10-month moving average are selected. The capital share of assets not meeting this criteria is allocated to cash.
| Asset Type | ETF | Weight |
| US Large Cap Value | VTV | 5% |
| US Large Cap Momentum | MTUM | 5% |
| US Small Cap Value | VBR | 5% |
| US Small Cap Momentum | XSMO | 5% |
| Foreign Developed | VEA | 10% |
| Foreign Emerging | VWO | 10% |
| US 10 Year Government Bonds | IEF | 5% |
| Foreign 10 Year Government Bonds | IGOV | 5% |
| US Corporate Bonds | VCIT | 5% |
| US 30 Year Gove Government Bonds | TLT | 5% |
| Gold | GLD | 10% |
| Commodities | DBC | 10% |
| Real Estate | VNQ | 20% |
| CASH | BIL |
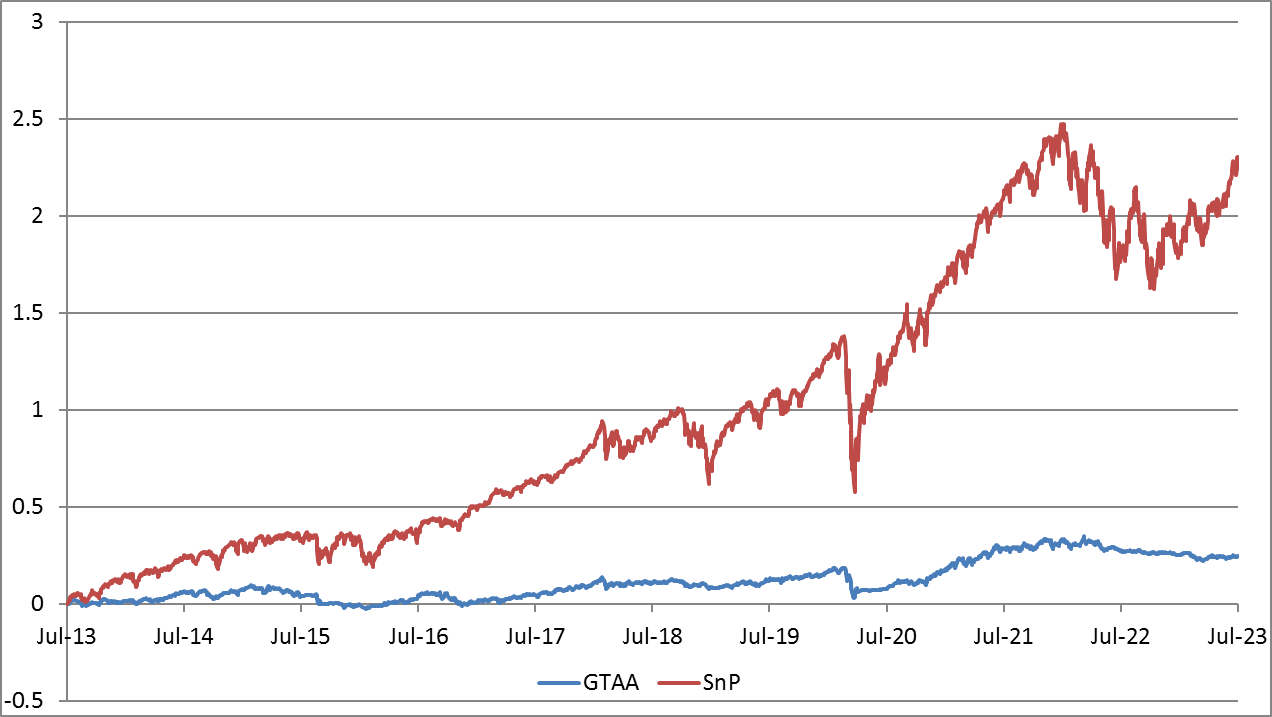
| CAGR | Sharpe | MaxDD | |
| GTAA | 2.2% | 0.36 | -13.7% |
| SnP | 12.7% | 0.68 | -33.7% |
- David Swensen's Yale Model. This approach, proposed by David Swensen, who managed Yale University's endowment, involves a diversified portfolio that includes domestic equities, foreign equities, real estate, bonds, and alternative investments. In this article, we will not include alternative investments and instead will focus on a simplified version of the portfolio. You can read more about David Swensen's approach in his book, 'Unconventional Success: A Fundamental Approach to Personal Investment'. The portfolio composition is as follows:
| Asset type | ETF | Weight |
| US Stocks | VTI | 30% |
| Foreign Developed Stocks | VEA | 15% |
| Foreign Emerging Stocks | VWO | 5% |
| Real Estate | VNQ | 20% |
| Long Term Bonds US | TLT | 15% |
| Inflation Protected Bonds | TIP | 15% |
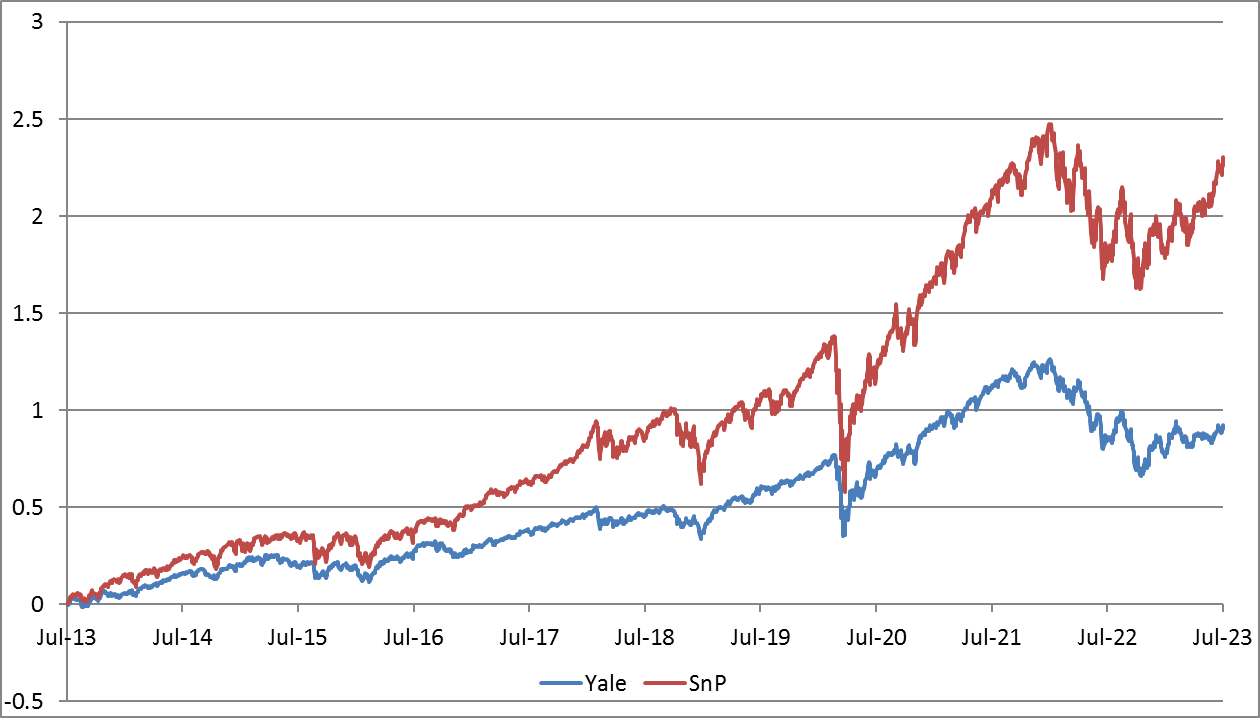
| CAGR | Sharpe | MaxDD | |
| Yale Model | 6.7% | 0.57 | -29.9% |
| SnP | 12.7% | 0.68 | -33.7% |
- Dual momentum. Gary Antonacci's Dual Momentum strategy is an investment approach that combines relative strength price momentum with trend-following absolute momentum. Here is a brief description:
- Relative Momentum: This portion of the strategy involves comparing the performance of different assets or asset classes and selecting the one that has outperformed the others over a certain lookback period. For instance, you could compare the performance of domestic stocks to international stocks and choose the one with the highest returns over the past year.
- Absolute Momentum: This concept involves assessing the performance of a selected asset or asset class in comparison to a risk-free rate (such as a Treasury bill). If the asset’s return exceeds the risk-free rate, then the investment remains. Otherwise, the strategy calls for switching to a safer asset, like bonds.
We tested simple version of this strategy (GEM - Global Equities Momentum) with the following rules:
- We check the S&P 500 index's performance over 12 months. If it's lower than the yield of Treasury Bills, we buy an ETF tracking the bond index (BND).
- Otherwise, we compare the 12-month performance of the US stock index with the global index excluding the US. If the return on the US index is greater, we purchase SPY, otherwise, we go for VEU.
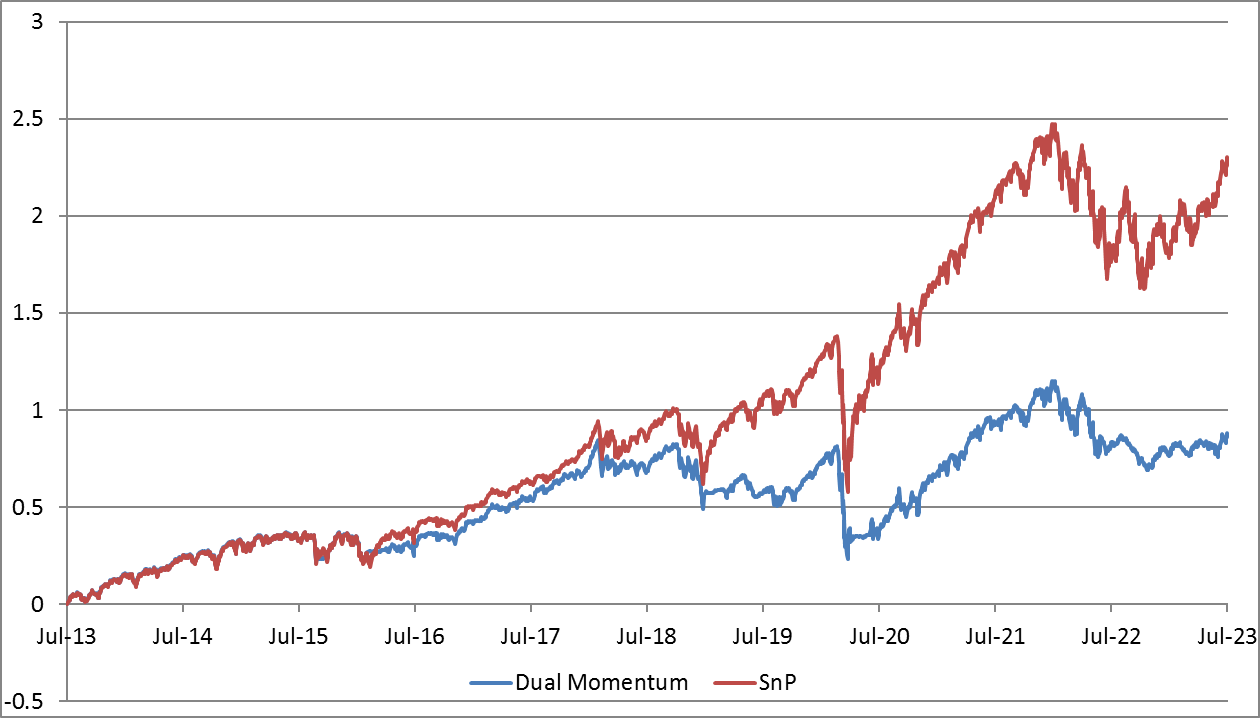
| CAGR | Sharpe | MaxDD | |
| GEM | 6.5% | 0.50 | -36.5% |
| SnP | 12.7% | 0.68 | -33.7% |
- Flexible Asset Allocation. This approach was proposed by W.Keller in a paper Generalized Momentum and Flexible Asset Allocation (FAA): An Heuristic Approach. The rules, in brief, are as follows. We utilize a universe of 7 assets:
| Asset type | ETF |
| US Stocks | VTI |
| Foreign Developed Stocks | VEA |
| Foreign Emerging Stocks | VWO |
| Cash | SHY |
| Bonds | BND |
| Commodities | GSG |
| Real Estate | VNQ |
The top three assets are purchased in equal proportions, selected based on an integrated indicator. This indicator is calculated from four components:
- Relative Momentum (R). We calculate the return of each asset over 4 months. We then rank the obtained values.
- Absolute Momentum (A). We also calculate the return of each asset over 4 months. This is used as a filter - if the selected assets have an absolute momentum less than 0, we switch their portion to cash.
- Volatility (V). We calculate the volatility of each asset's return over a 4-month period based on daily returns. We utilize inverse ranking - the higher the volatility, the lower the asset's ranking.
- Average Correlation (C). We calculate the average correlation between the return of the selected asset and the rest. The higher the correlation, the lower the asset ranking.
The final score is calculated using the formula L = rank(R) + 0.8 * rank'(V) + 0.6 * rank'(C)
We rank the assets based on their L score. The top 3 assets (those with the highest rank(L)) are purchased. If any of these assets have a negative absolute momentum (A), its share is replaced with cash.
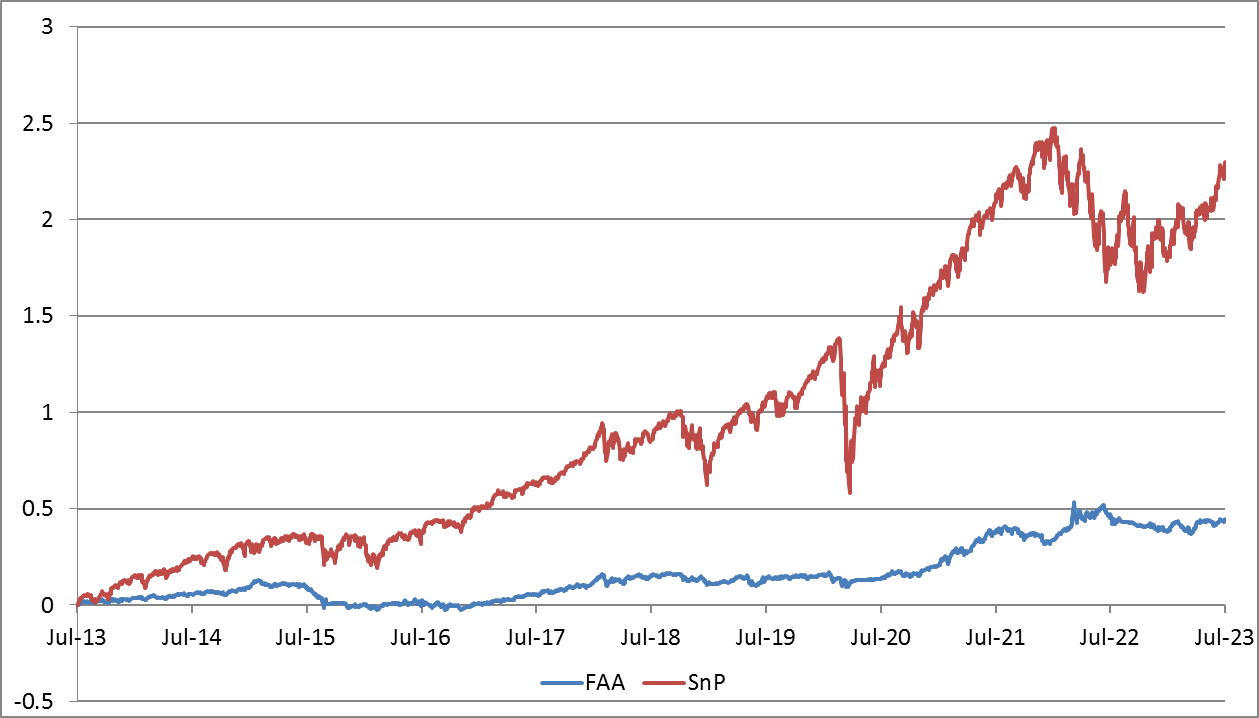
| CAGR | Sharpe | MaxDD | |
| Flexible Asset Allocation | 3.7% | 0.54 | -14.5% |
| SnP | 12.7% | 0.68 | -33.7% |
- Minimum variance. In this strategy, we use three types of assets - US stocks (SPY), long-term government bonds (TLT), and gold (GLD). We build a covariance matrix of asset returns over the last quarter and, using the nlopt library (COBYLA model), optimize the weights of the instruments to achieve minimal portfolio volatility. We then normalize the obtained weights to achieve a target portfolio volatility of 12%. As this procedure can potentially lead to a large leverage, we set a limit of 100%. We rebalance every 21 working days (approximately one calendar month).
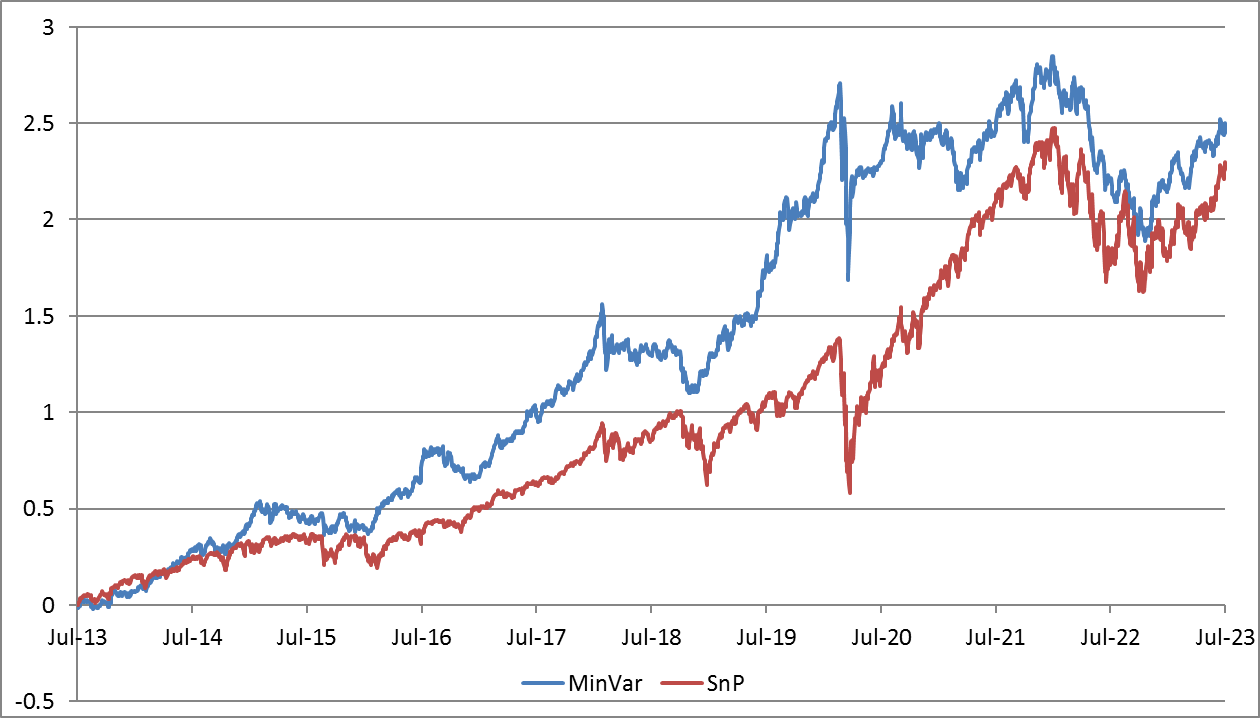
| CAGR | Sharpe | MaxDD | |
| MinVar | 13.3% | 0.93 | -31.0% |
| SnP | 12.7% | 0.68 | -33.7% |
- Adaptive asset allocation. This approach was proposed in 2012 in the paper Adaptive Asset Allocation: A Primer. Here's how it works:
- From the pool of 10 assets, we select the top 5 based on their 6-month momentum.
- We optimize the weight of each of the 5 selected assets to minimize the overall portfolio volatility. We will also use nlopt for this. We set a lower limit for asset weights at 10% and an upper limit at 70%.
The used assets are as follows:
| Asset type | ETF |
| US Stocks | SPY |
| European stocks | VGK |
| Japanese stocks | EWJ |
| Foreign Emerging Stocks | VWO |
| US Real Estate | VNQ |
| International Real Estate | RWX |
| US 7-10 year Treasuries | IEF |
| US 20+ year Treasuries | TLT |
| Commodities | GSG |
| Gold | GLD |
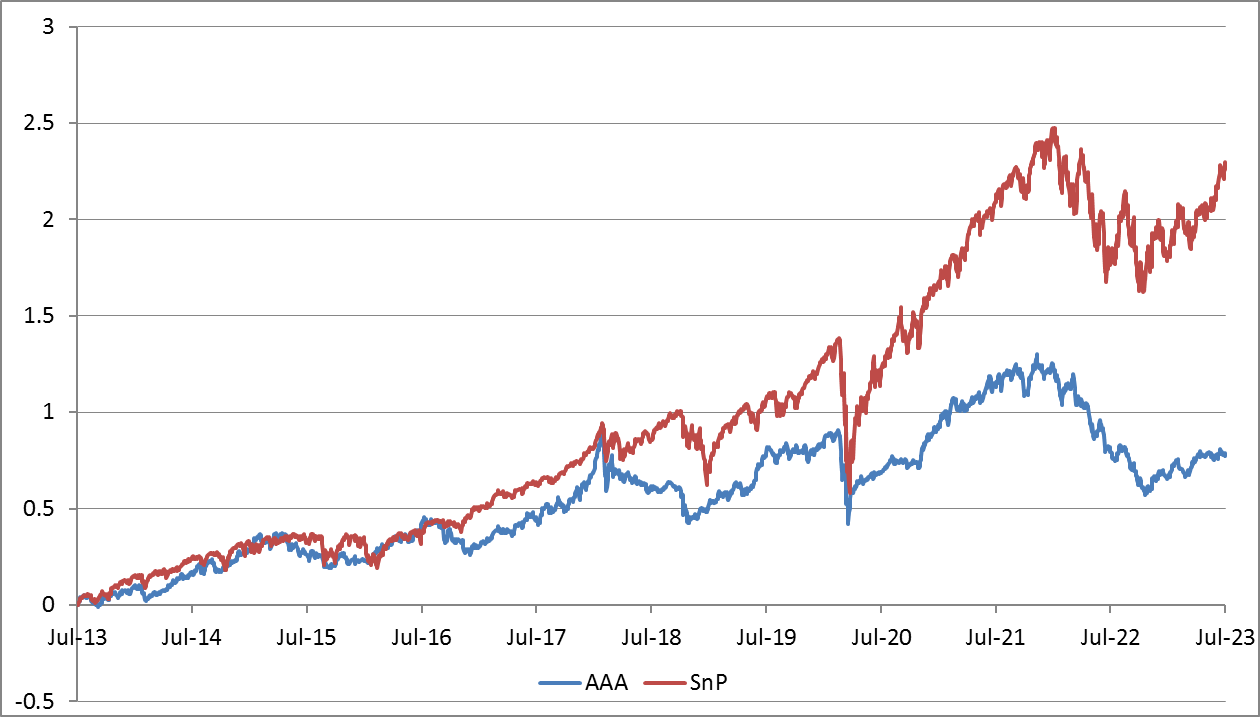
| CAGR | Sharpe | MaxDD | |
| Adaptive Asset Allocation | 6.0% | 0.46 | -37.3% |
| SnP | 12.7% | 0.68 | -33.7% |
We have reviewed the results of the most well-known asset allocation models. Regrettably, over the last 10-year period, almost all of these strategies provided significantly lower returns than the stock index. This underperformance is not just in terms of profitability, which might be understandable as many models aim to reduce risk, but also in terms of the Sharpe ratio, suggesting worse risk-adjusted returns.
| CAGR | Sharpe | MaxDD | |
| SnP Index | 12.7% | 0.68 | -33.7% |
| 60_40 | 8.8% | 0.82 | -30.9% |
| Risk Parity | 3.2% | 0.44 | -18.3% |
| All Weather | 5.1% | 0.63 | -25.7% |
| GTAA | 2.2% | 0.36 | -13.7% |
| Yale Model | 6.7% | 0.57 | -29.9% |
| GEM (Dual momentum) | 6.5% | 0.50 | -36.5% |
| Flexible Asset Allocation | 3.7% | 0.54 | -14.5% |
| MinVar | 13.3% | 0.93 | -31.0% |
| Adaptive Asset Allocation | 6.0% | 0.46 | -37.3% |
The only model that outperformed the S&P500 index in terms of both parameters is the Minimum Variance. The simple 60/40 portfolio also showed acceptable results in terms of risk-return profile, but it significantly lagged the market in terms of absolute return and failed to reduce drawdown. All the remaining models appeared very weak. Despite being proposed and promoted by well-known authors, their impressive historical results rapidly deteriorated as soon as the long-term trend of declining interest rates was broken.
Thus, over the recent 10-year period, most simple asset allocation models have proven to be ineffective, suggesting at best an issue of overfitting, and at worst, possible manipulation. While one might argue about the unusually sharp increases in rates, it's perhaps more accurate to consider the past 40 years, marked by a virtually uninterrupted decline in rates, as the truly unusual period.